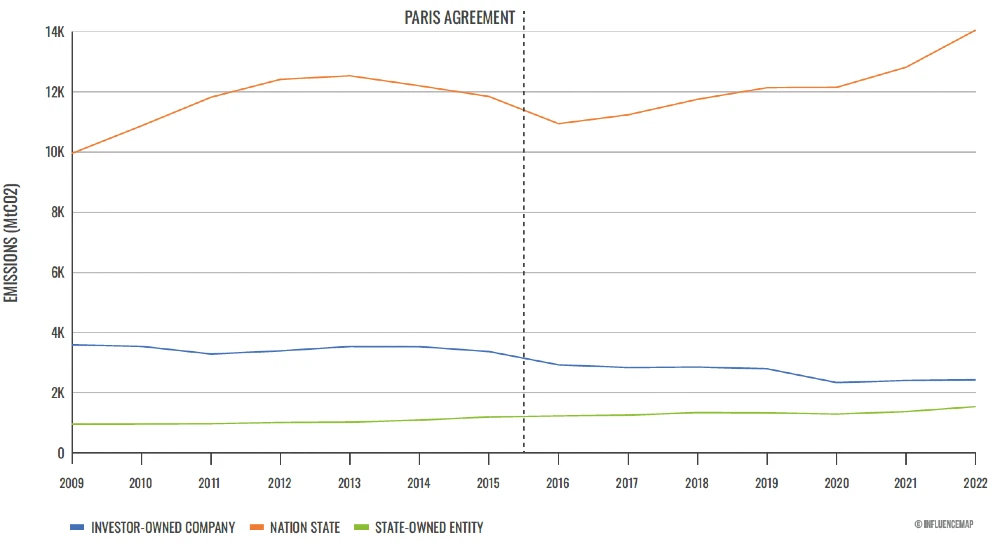
Let’s get straight to the point: Just 57 companies are behind a whopping 80% of the world’s carbon emissions from 2016 to 2022. This 100% data-backed info comes from InfluenceMap, and it should change how we think about who’s really heating up our planet. Basically, now we know where exactly to place 80% of the blame! Despite all the talks and pledges to cut down emissions, many of these big players have done the exact opposite, pumping out more fossil fuels and, with it, more carbon dioxide. And this was after the world vowed to do better with the Paris Agreement in 2016.
Not to worry, we read through and analyzed the results of the study on your behalf! Everything you want to know is below.
Coal, Oil, Gas, Cement: The Usual Suspects
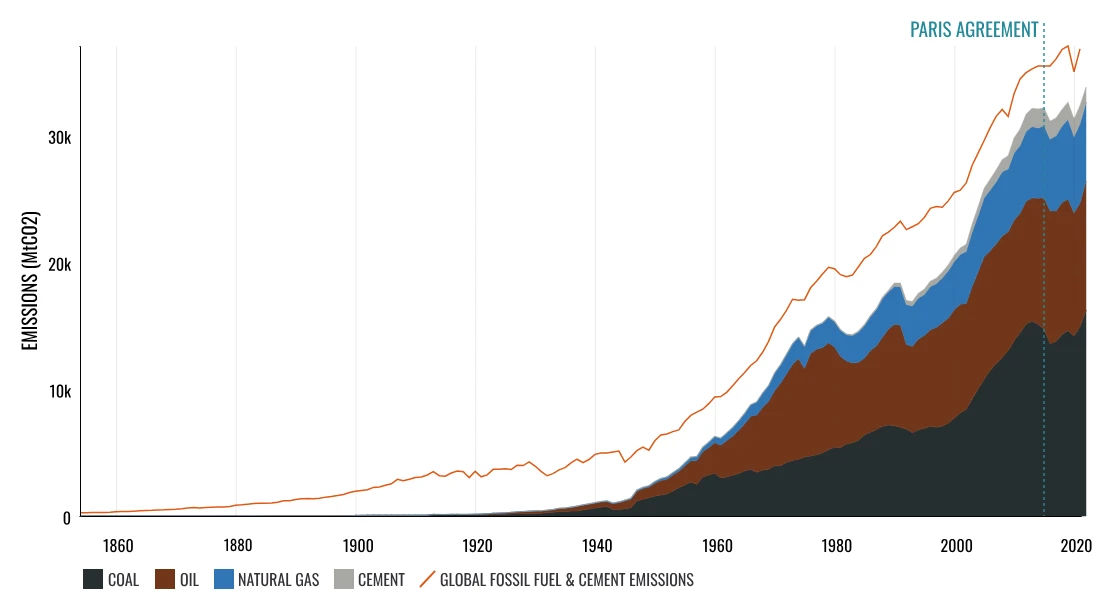
The bulk of this carbon mess comes from coal, oil, natural gas, and cement – no surprises there. In 2022 alone, they contributed around 30,000 megatons of CO2. What’s more telling is the shift towards state-owned entities taking a larger share of coal production, hinting at a strategic move away from private companies to government control, without really dialing down on the emissions.
Who’s Up and Who’s Down
Across the globe, the trend is clear: many companies have cranked up their emissions since the Paris Agreement. In Asia, a staggering 87% of companies reviewed have ramped up their operations, a pattern that repeats across the Middle East, Europe, and beyond. North America presents a mixed bag, with a noteworthy (and surprising) chunk of companies actually reducing their carbon footprint since 2016.
Profit Over Planet?
These companies, despite pocketing billions, have been dragging their feet on climate action. They’ve been caught lobbying against climate policies that would force them to clean up their act. Some have even been caught outright greenwashing for publicity. But all of them have one thing in common – a disconnect between their profit-driven motives and the urgent need for action against climate change, regardless of what their PR and social media accounts say.
So, What Now?
This isn’t just about pointing fingers. It’s a wake-up call. These findings from the Carbon Majors Database spotlight exactly where the major work needs to happen to curb global emissions. It’s clear that transitioning away from fossil fuels towards renewable energy isn’t just an option but a necessity.
The Big Chart of Culprits
CO2 Emissions from 2016-2022, After The Paris Agreement
| Entity | Emissions (MtCO2e) | Percentage of global emissions |
|---|---|---|
| China (Coal) | 72,993 | 25.79% |
| Saudi Aramco | 13,256 | 4.84% |
| Gazprom | 10,127 | 3.26% |
| Coal India | 8,509 | 3.01% |
| National Iranian Oil Co. | 8,176 | 2.80% |
| China (Cement) | 8,155 | 3.21% |
| Russian Federation | 7,174 | 2.53% |
| Rosneft | 5,734 | 2.07% |
| CNPC | 4,966 | 1.71% |
| Abu Dhabi National Oil Company | 4,746 | 1.70% |
| ExxonMobil | 4,086 | 1.42% |
| Iraq National Oil Company | 3,695 | 1.37% |
| Shell | 3,621 | 1.24% |
| BP | 3,513 | 1.22% |
| Sonatrach | 3,408 | 1.14% |
| Chevron | 3,326 | 1.16% |
| Kuwait Petroleum Corp. | 3,046 | 1.12% |
| TotalEnergies | 2,877 | 1.00% |
| Petrobras | 2,839 | 1.03% |
| Pemex | 2,648 | 0.96% |
| Peabody Coal Group | 2,394 | 0.85% |
| Glencore | 2,313 | 0.82% |
| Lukoil | 2,310 | 0.83% |
| Petronas | 2,223 | 0.76% |
| Nigerian National Petroleum Corp. | 2,107 | 0.74% |
| Equinor | 1,979 | 0.68% |
| Kazakhstan | 1,901 | 0.67% |
| Eni | 1,752 | 0.60% |
| BHP | 1,738 | 0.61% |
| Petroleos de Venezuela | 1,710 | 0.61% |
| ConocoPhillips | 1,709 | 0.60% |
| Poland | 1,686 | 0.60% |
| QatarEnergy | 1,652 | 0.56% |
| Novatek | 1,570 | 0.51% |
| CNOOC | 1,467 | 0.53% |
| Sinopec | 1,441 | 0.51% |
| Surgutneftegas | 1,373 | 0.50% |
| Bumi Resources | 1,355 | 0.48% |
| TurkmenGaz | 1,315 | 0.42% |
| Occidental Petroleum | 1,283 | 0.46% |
| Canadian Natural Resources | 1,137 | 0.41% |
| Arch Resources | 1,129 | 0.40% |
| Petoro | 1,073 | 0.36% |
| Petroleum Development Oman | 1,033 | 0.36% |
| ONGC India | 920 | 0.32% |
| Pertamina | 884 | 0.30% |
| Anglo American | 883 | 0.31% |
| Egyptian General Petroleum | 877 | 0.29% |
| Singareni Collieries | 869 | 0.31% |
| Libya National Oil Corp. | 841 | 0.30% |
| American Consolidated Natural Resources | 835 | 0.29% |
| Sonangol | 813 | 0.30% |
| Adaro Energy | 802 | 0.28% |
| Exxaro Resources Ltd | 779 | 0.28% |
| EOG Resources | 778 | 0.28% |
| Sasol | 776 | 0.27% |
| Cenovus Energy | 762 | 0.27% |
| EQT Corporation | 742 | 0.24% |
| Ecopetrol | 728 | 0.26% |
| Suncor Energy | 726 | 0.27% |
| Repsol | 708 | 0.24% |
| Banpu | 707 | 0.25% |
| RWE | 686 | 0.24% |
| Coterra Energy | 675 | 0.22% |
| Chesapeake Energy | 658 | 0.21% |
| BASF (Wintershall Dea) | 654 | 0.22% |
| Alliance Resource Partners | 613 | 0.22% |
| Devon Energy | 608 | 0.21% |
| Southwestern Energy | 606 | 0.19% |
The Bottom Line
It’s easy to feel like our individual actions against climate change are just drops in the ocean. But when you realize that just 57 companies are behind the lion’s share of the problem, it becomes clear where the real change needs to happen. It’s time for these giants to lead by example and pivot towards sustainability.


